A few days ago I published a post with a video of Carlos González in which he explains the correct interpretation of the weight and height tables. I wrote a summary of the video and here I leave the second part of it.
The weight
With the weight the percentiles work the same, we would take 100 healthy children and order them by weight, regardless of their height. Each child's position would be equivalent to their percentile.
It often happens that if a child is in the 3rd, 10th or even 25th percentile, they tell you, because it is below the average, that it is the 50th percentile, that "he is just in weight." If he is in 25, they say he is just, if he is in 10 they tell you that he is quite just and if he is in 3 they tell you that “oops, he is very underweight” (I do not say that it is always like that, but often and I have witnessed). In all three cases the solution is usually for the child to eat more. And in all three cases there is most likely a interpretation error of the graph and of concept.
The child in the 3rd percentile is part of the 100 healthy children we have taken. Even if it were below 3, in the 1st percentile, it could still be part of the 100 healthy children, only the tables start at 3.
To recommend to all children who are below the 50th percentile to eat more, simply so that they reach 50, which is the average, only makes the average of the graph cease to be real, to move up and perfectly normal children and healthy end up weighing more than expected of them and increase rates of childhood obesity.
That is to say, 50% of children have to be below the 50th percentile.
The strange thing is that the child who is in the 25th percentile, is a child misnamed "justito de peso", but the one in the 75th, is not "pass of weight." The one in 3 is very low in weight, but the one in 97 is not said to be very high in weight, but is said to be majestic or huge, always with a big smile on his lips.
Given that we are in a developed country and that the biggest nutritional problem of the moment is obesity and not malnutrition, it is a bit strange that those who are told about possible nutritional problems are the majority of those who fall below 50 and not to those who surpass it.
The little way
The graphs and the percentiles do not mark paths that children have to follow, however many pediatricians and nurses use that term: "as long as you are still in your path, everything will be fine."
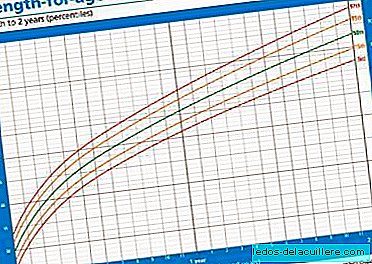
If we see the image on the right, we can see many dots of different colors and lines that seem to be the same as those of the graphics. Well, the true percentiles are not the lines we are used to seeing, but the points.
If we made a line joining the points we would see that the percentiles are not straight lines but that they are authentic “saws” and that they often touch the upper or lower percentile.
Therefore, it is normal for children to often touch and pass higher and lower percentiles. In fact Only 15% of children from 0 to 6 months follow their "path".
I am the father of a child who has crossed the 1st and 3rd percentiles, both in height and in weight and we have received a few tips and indications (weaning, artificial milk, forcing to eat, etc.) to which we have fortunately ignored .
I am also a professional who has seen erroneous assessments of the graphics with the consequent fright of the mothers.
I hope that both professionals and mothers and fathers learn to interpret the graphs (especially the first ones) to avoid unnecessary worries in cases where there is no alteration or in which said alteration is a variant of normality.